
SH6A Frankton Rd
28,921 vehicles/day
average, Jul 2026
+4.1% vs Jul 2025 (27,771)
Heavy vehicles 5.32%
Data to 23 Aug 2026. NZTA has not yet published later counts for this site.
NZTA, ORC and QLDC
Last updated:
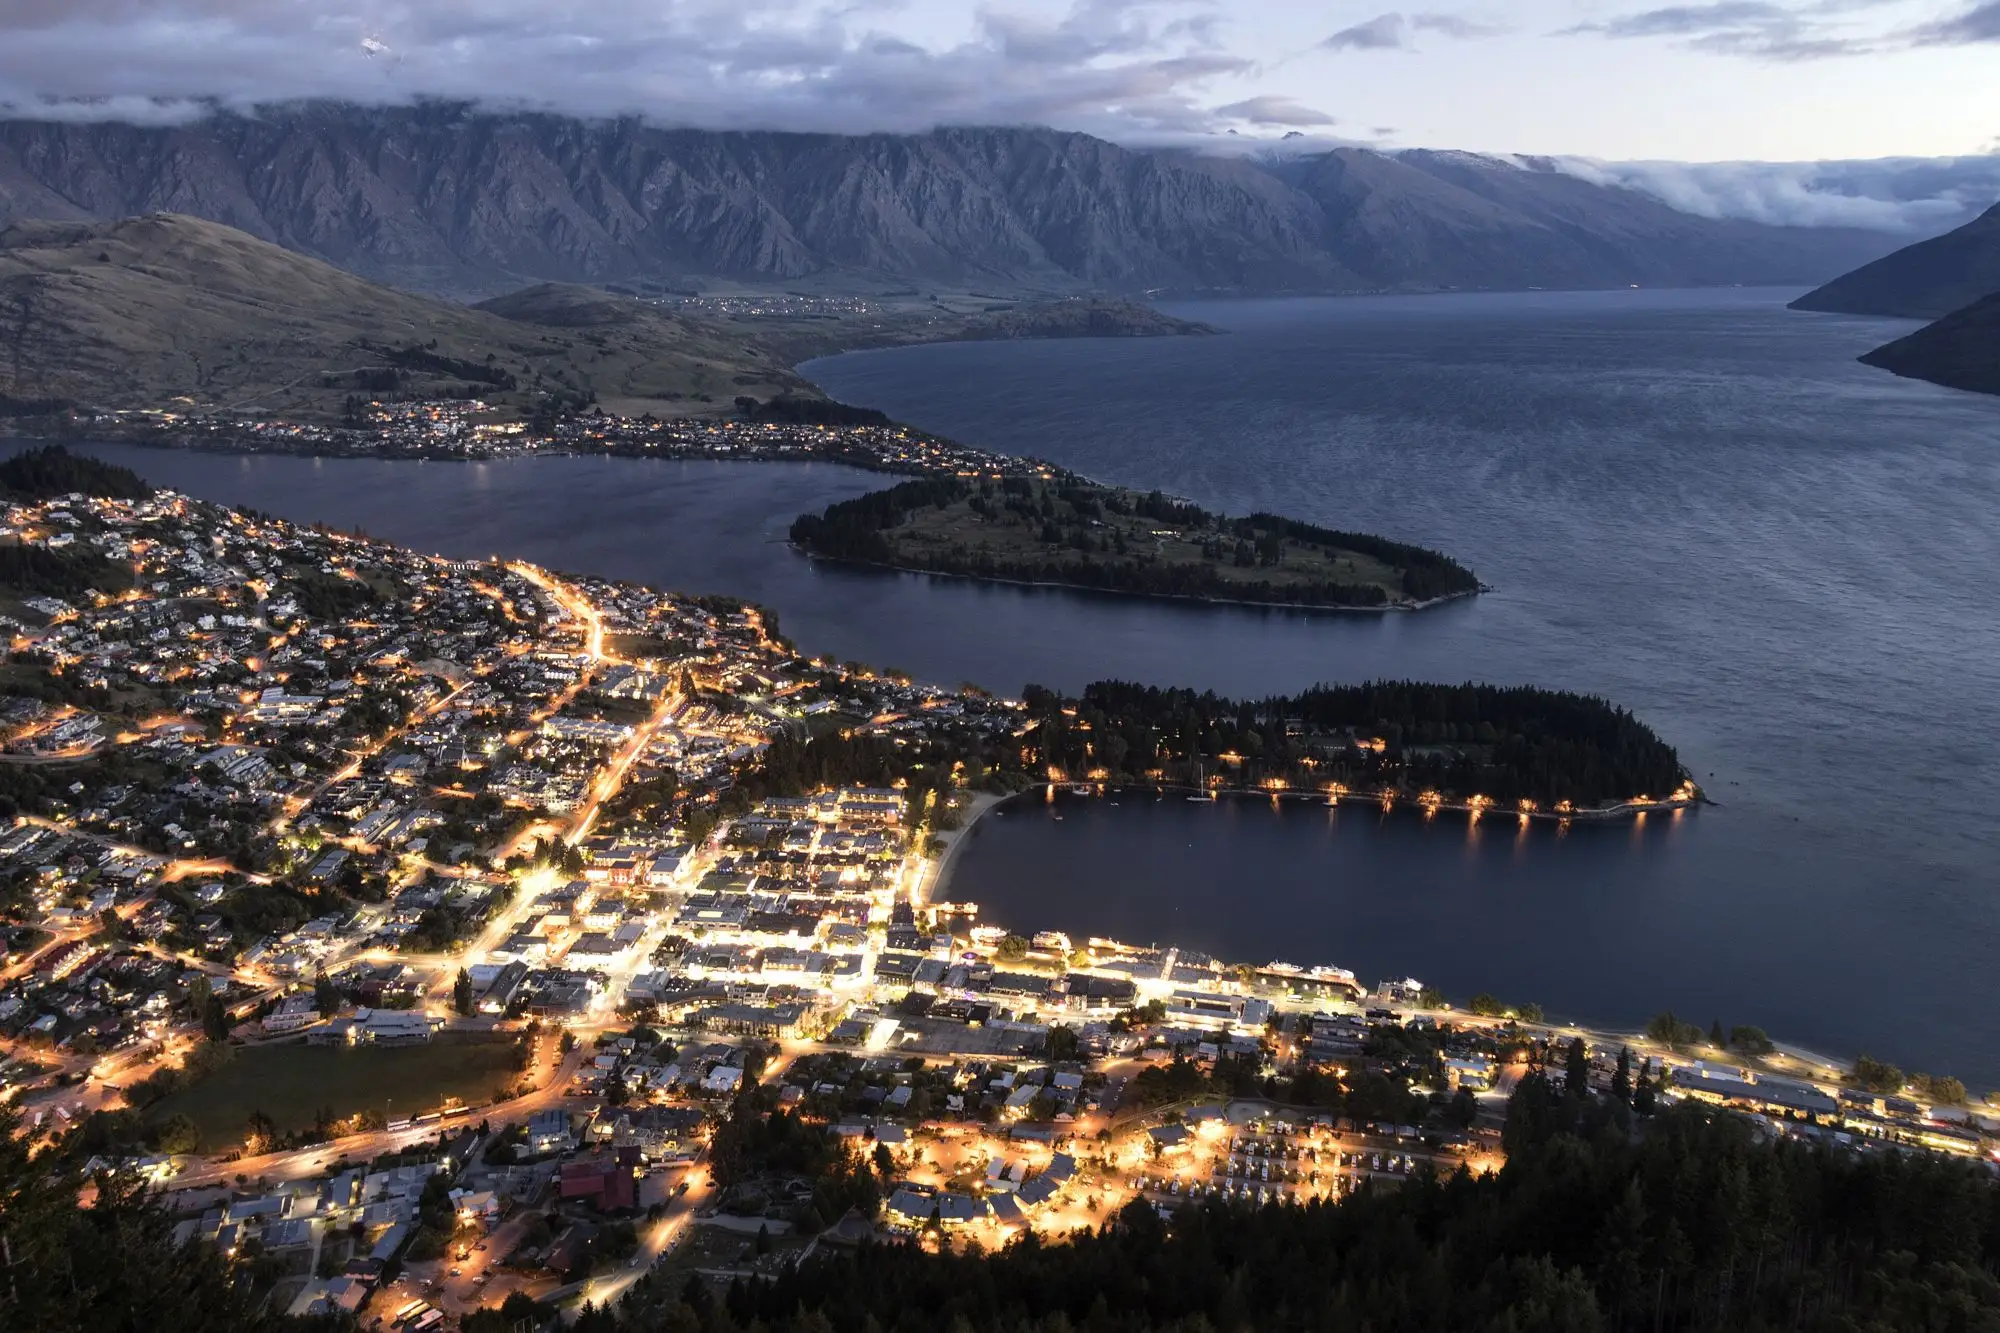
How Queenstown's roads, buses and ferry are being used, from public data published by NZTA, Otago Regional Council and QLDC. Each figure shows the date its data runs to. Traffic counts are published by NZTA in batches, typically 3–5 weeks after the day counted.
Traffic data checked: 18 Oct 2026, 5:16 pm · latest traffic day: 20 Sep 2026. Showing data as at build time.
28,921 vehicles/day
average, Jul 2026
+4.1% vs Jul 2025 (27,771)
Heavy vehicles 5.32%
Data to 23 Aug 2026. NZTA has not yet published later counts for this site.
23,146 vehicles/day
average, Jul 2026
+5.4% vs Jul 2025 (21,968)
Heavy vehicles 3.29%
Data to 20 Sep 2026.
29,352 vehicles/day
average, Aug 2026
+0.6% vs Aug 2025 (29,188)
Heavy vehicles 3.81%
Data to 20 Sep 2026.
27,896 vehicles/day
average, Jul 2026
+1.2% vs Jul 2025 (27,565)
Heavy vehicles 3.59%
Data to 20 Sep 2026.
19,611 vehicles/day
average, Aug 2026
+1.9% vs Aug 2025 (19,245)
Heavy vehicles 4.3%
Data to 20 Sep 2026.
19,556 vehicles/day
average, Aug 2026
+7.1% vs Aug 2025 (18,252)
Heavy vehicles 3.21%
Data to 20 Sep 2026.
14,505 vehicles/day
average, Aug 2026
+11.7% vs Aug 2025 (12,991)
Data to 20 Sep 2026.
167,059
Jun 2026
+5.2% vs same month last year
2025/26: 2,094,772 boardings (12 months)
vs 1,966,086 in previous year
Data to Jun 2026. Source: ORC.
94,135 trips in 2025/26
+32% vs 2024/25
Data to 30 Jun 2026.
90.1% of scheduled trips departed on time (2025/26)
Punctuality 63.0%
Reliability = trips departing on time / scheduled trips; punctuality = trips arriving on time / operated trips (QLDC definitions) Source: QTS-204 slide 10.
Data to 30 Jun 2026.
2,241 vehicles
SH6A Frankton Rd busiest-hour median (max 3,257)
Most common start hour 5 pm.
2022–24 baseline – NZTA has not published hourly counts since January 2025
Charts, tables and cameras load as you reach them.Open that section if it does not appear.